0去购物车结算
购物车中还没有商品,赶紧选购吧!
当前位置: 图书分类 > 地球天文 > 地质学 > 复杂地质环境下岩质边坡破坏机理及稳定性研究(英文版)

相同语种的商品

浏览历史

复杂地质环境下岩质边坡破坏机理及稳定性研究(英文版)


联系编辑
 
标题:
 
内容:
 
联系方式:
 
  
复杂地质环境下岩质边坡破坏机理及稳定性研究(英文版)
  • 书号:9787030663054
    作者:张科
  • 外文书名:
  • 装帧:平装
    开本:B5
  • 页数:267
    字数:
    语种:en
  • 出版社:科学出版社
    出版时间:2020-10-01
  • 所属分类:
  • 定价: ¥179.00元
    售价: ¥141.41元
  • 图书介质:
    纸质书

  • 购买数量: 件  可供
  • 商品总价:

相同系列
全选

内容介绍

样章试读

用户评论

全部咨询

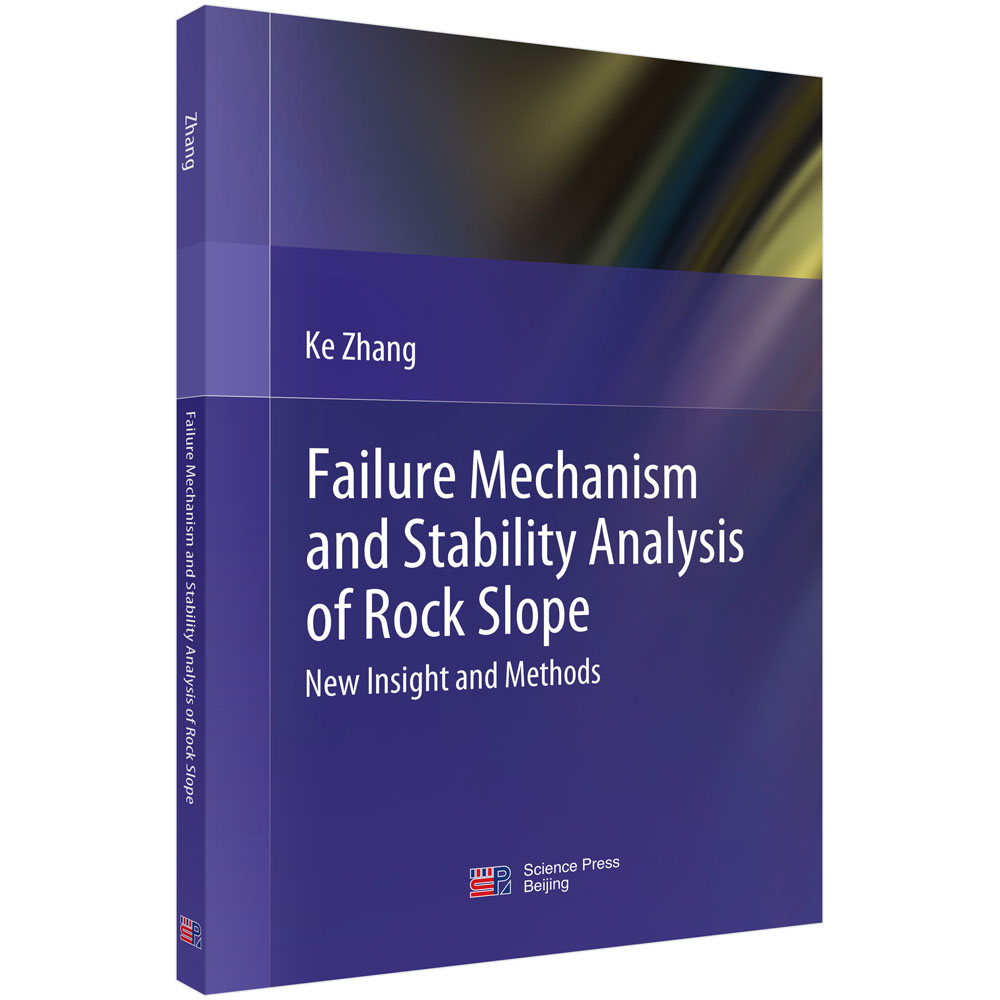
围绕复杂地质环境下高岩质边坡安全控制问题,根据岩质边坡失稳破坏模式,本书将坡体结构划分为碎裂结构以及结构面控制型。综合运用岩体力学、弹塑性力学、断裂力学以及分形理论等多学科理论,遵循“地质概化、理论建模、试验验证、数值模拟、工程应用”的研究路线,依托我国露天矿、路堑以及库区高陡边坡工程,开展复杂地质环境下岩质边坡破坏机理的基础研究,揭示了不同坡体结构的岩质边坡变形与稳定性动态演化特征,构建了针对不同坡体结构的岩质边坡性能综合评价指标体系与评估方法。本书系统介绍了作者近年来在复杂地质环境下岩质边坡破坏机理及稳定性研究方面所取得的学术成果。
样章试读
  • 暂时还没有任何用户评论
总计 0 个记录,共 1 页。 第一页 上一页 下一页 最末页

全部咨询(共0条问答)

  • 暂时还没有任何用户咨询内容
总计 0 个记录,共 1 页。 第一页 上一页 下一页 最末页
用户名: 匿名用户
E-mail:
咨询内容:

目录

  • Contents
    Preface
    List of Figures
    List of Tables
    Chapter 1 Introduction 1
    1.1 Background 1
    1.2 Crack Propagation and Coalescence in Rocks 3
    1.3 Numerical Methods of Rock Slope Stability Analysis 5
    1.4 Main Contents in This Book 8
    References 13
    Part I Experimental Studies on Shear Failure Mechanism of Rock Masses
    Chapter 2 Influence of Flaw Inclination on Shear Fracturing and Fractal Behavior 21
    2.1 Experimental Studies 22
    2.2 Patterns of Crack Propagation and Coalescence 25
    2.3 Peak Shear Strength of Flawed Specimens 34
    2.4 Fractal Characteristics of the Fragmentation 36
    2.5 Conclusions 40
    References 41
    Chapter 3 Influence of Flaw Density on the Shear Fracturing and Fractal Behavior 43
    3.1 Experimental Studies 44
    3.2 Numerical Shear?Box Tests with the RFPA Model 50
    3.3 Shear Fracturing Behavior of Rock Bridges 53
    3.4 Fractal Characteristics of the Shear Fracture Surface 61
    3.5 Conclusions 66
    References 67
    Part II Large-Scale, Global Failure Mechanism and Stability Analysis
    Chapter 4 Empirical Methods for Estimating Strength Parameters of Jointed Rock Masses 73
    4.1 Methods Relating Strength with RQD 74
    4.2 Methods Relating Strength with Q 75
    4.3 Methods Relating Strength with RMR 75
    4.4 Methods Relating Strength with Hoek-Brown Failure Criterion and GSI 76
    References 78
    Chapter 5 Kinematical Element Method 80
    5.1 Kinematical Element Formulation Subjected to Seismic Loading and Water 81
    5.2 Numerical Studies and Verification 86
    5.3 Blasting Effect on Slope Stability and Example Analysis 91
    5.4 Seismic Stability Charts for Slopes 95
    5.5 Rigorous Back Analysis 102
    5.6 Reliability Analysis 111
    5.7 Conclusions 115
    References 116
    Chapter 6 Integrated Karst Cave Stochastic Model-Limit Equilibrium Method 119
    6.1 Engineering Background 121
    6.2 A Monte Carlo Simulation to Generate a Karst Cave Stochastic Model 125
    6.3 Integrated Methodology for Stability Analysis 131
    6.4 Optimization Design of the Slope Angle 140
    6.5 Conclusions 146
    References 148
    Chapter 7 Strain-Softening Behavior and Strength Reduction Method 151
    7.1 Progressive Failure and Improved Strength Reduction Method 151
    7.2 Numerical Study and Verification 155
    7.3 Progressive Failure Analysis 160
    7.4 Parameters Analysis 161
    7.5 Application 164
    7.6 Conclusions 166
    References 167
    Chapter 8 Three-Dimensional Effect and Strength Reduction Method 170
    8.1 Three-Dimensional Effect of Boundary Conditions 172
    8.2 Three-Dimensional Effect of Strength Parameters 176
    8.3 Stability Charts for Three-Dimensional Slope 180
    8.4 Three-Dimensional Effect of Concentrated Surcharge Load 190
    8.5 Calculation Procedure for Slope Stability Analysis 194
    8.6 Conclusions 195
    References 196
    Part III Structurally-Controlled Failure Mechanism and Stability Analysis
    Chapter 9 Discontinuity Kinematical Element Method 201
    9.1 Discontinuity Kinematical Element Formulation with Major Geological Discontinuities 202
    9.2 Numerical Studies and Verification 206
    9.3 Rock Slope with Non-Persistent Discontinuities 210
    9.4 Application 214
    9.5 Conclusions 216
    References 217
    Chapter 10 Joint Element and Strength Reduction Method 219
    10.1 Engineering Background 220
    10.2 Discontinuity Modelling in DDM 221
    10.3 Modelling of Failure Initiation 227
    10.4 Discontinuity Modelling in FLAC 3D 228
    10.5 Modelling of Progressive Failure 231
    10.6 Role of Joint Inclination on Slope Stability 237
    10.7 Conclusions 240
    References 242
    Chapter 11 Fracture Mechanics Method 244
    11.1 Engineering Background 246
    11.2 Theoretical Formulation 251
    11.3 Modelling Fracture Behavior 252
    11.4 Role of Joint Geometry Parameters on Slope Stability 253
    11.5 Evolution of Slopes Subject to Weathering 258
    11.6 Conclusions 264
    References 265
    List of Figures
    List of Figures
    Fig.1.1 Guobu slope on the upper stream of Laxiwa dam 1
    Fig.1.2 High rock slope in Shilu iron mine 2
    Fig.1.3 Discontinuities in a rock slope 3
    Fig.1.4 Two fundamental types of cracks 4
    Fig.1.5 Failure mode of rock slope assumed by Sarma method 6
    Fig.1.6 Three loading modes applied to a crack 8
    Fig.1.7 Idealized diagram showing the influence of scale on the type of rock mass behavior 9
    Fig.1.8 A large-scale, global failure in an open pit mine 9
    Fig.1.9 Schematic diagram of structurally-controlled instability 10
    Fig.1.10 A structurally-controlled failure in an open pit mine 10
    Fig.2.1 Aishihik River landslide 21
    Fig.2.2 Randa rockslide and test element modified after Eberhardt et al.(2004) 22
    Fig.2.3 Geometry of the specimen containing mixed flaws 23
    Fig.2.4 View of the specimens ready to be tested 24
    Fig.2.5 Layout of the loading system 25
    Fig.2.6 Stress states in the rock slope and the shear-box test 25
    Fig.2.7 Patterns of tensile crack propagation observed in our experiments 27
    Fig.2.8 Patterns of tensile crack propagation observed in the uniaxial compression tests 27
    Fig.2.9 An inclined flaw subjected to a uniform shear-normal loading 28
    Fig.2.10 Comparison of crack initiation angles predicted from three fracture criteria, with experimental results for α = 60° 29
    Fig.2.11 Comparison of crack initiation angles predicted from three fracture criteria, with experimental results for α = 45° 30
    Fig.2.12 Shear cracks and coalescence trajectories for the samples with two edge-notched flaws 30
    Fig.2.13 Patterns of shear crack propagation observed in our experiments 31
    Fig.2.14 Shear cracks and coalescence trajectories for the base friction model modified after Goricki and Goodman (2003) 32
    Fig.2.15 Patterns of crack propagation and coalescence for α = 60° 32
    Fig.2.16 Patterns of crack propagation and coalescence for α = 45° 33
    Fig.2.17 Fracture surfaces observed in preflawed specimens 34
    Fig.2.18 Peak shear strengths measured in our experiments 35
    Fig.2.19 Classification of fragments after the shear-box tests 37
    Fig.2.20 lgr versus lg[M(r)/M] 38
    Fig.2.21 Fractal dimension versus imbedded flaw inclination 38
    Fig.2.22 Correlation coefficient versus imbedded flaw inclination 39
    Fig.3.1 Schematic WNW–ESE cross-section of the 1991 Randa rockslide modified after Schindler et al.(1993) and Bois and Bouissou (2010), and conceptual rock bridge model 45
    Fig.3.2 Geometry of the specimen containing imbedded en-echelon flaws 46
    Fig.3.3 Layout of the loading system 48
    Fig.3.4 Failure patterns observed in our experiments 49
    Fig.3.5 Elastic-brittle model in the RFPA code (Li et al., 2009) 50
    Fig.3.6 Numerical shear-box test with the RFPA model 52
    Fig.3.7 Contours of minor principal stresses during the shear fracturing process 54
    Fig.3.8 Distributions of damaged elements during the shear fracturing process 55
    Fig.3.9 Peak shear strengths obtained in experimental tests and RFPA simulations 58
    Fig.3.10 Acceleration to generate rupture versus intermittent joint density in physical modelling modified after Bois and Bouissou (2010) 59
    Fig.3.11 Photograph of the Xiaowan hydroelectric station modified after Huang et al.(2015) 60
    Fig.3.12 Result by discrete element modelling modified after Scholtès and Donzé (2015) 60
    Fig.3.13 Binary images of rupture surfaces and lg–lg plots of N(δ) and δ estimated by the box-counting method: physical model (εf = 0.0125) 61
    Fig.3.14 Binary images of rupture surfaces and lg–lg plots of N(δ) and δ estimated by the box-counting method: RFPA model (εf = 0.0125) 62
    Fig.3.15 Fractal dimensions obtained in experimental tests and RFPA simulations 63
    Fig.3.16 Binary images of rupture surfaces and lg–lg plots of N(δ) and δ estimated by the box-counting method: physical model (εf = 0) 65
    Fig.3.17 Binary images of rupture surfaces and lg–lg plots of N(δ) and δ estimated by the box-counting method: RFPA model (εf = 0) 65
    Fig.3.18 Relationship between fractal dimension and peak shear strength 66
    Fig.4.1 Scaling of Hoek–Brown failure envelope for intact rock to that for rock mass strength 77
    Fig.5.1 Boundary conditions and kinematics 81
    Fig.5.2 A plastic sliding zone and the cross section of a slope 82
    Fig.5.3 Forces acting on Element i 84
    Fig.5.4 Process of search 86
    Fig.5.5 Slope section and results for Example 1 87
    Fig.5.6 Calculation model and mesh 88
    Fig.5.7 Process of convergence 89
    Fig.5.8 Comparisons of critical failure surfaces with vertical edges and inclined edges (Example 2, case 3, k = 0.2) 91
    Fig.5.9 Effect of blasting on the stability of slope 94
    Fig.5.10 Relationship between allowable explosive weight and distance 94
    Fig.5.11 Stability charts for slopes subjected to seismic loading (k = 0) 97
    Fig.5.12 Stability charts for slopes subjected to seismic loading (k = 0.1) 98
    Fig.5.13 Stability charts for slopes subjected to seismic loading (k = 0.2) 100
    Fig.5.14 Flow chart of back analysis 102
    Fig.5.15 Location of critical slip surfaces with the same value of c/tanφ 104
    Fig.5.16 Location of critical slip surfaces with different values of c/tanφ 105
    Fig.5.17 Flow chart of back analysis of shear strength parameters 107
    Fig.5.18 Slope geometry and critical failure surface by back analysis for Example 1 108
    Fig.5.19 Slope geometry and critical failure surface by back analysis for Example 2 109
    Fig.5.20 Slope geometry and critical failure surface by back analysis for Example 3 110
    Fig.5.21 Iterative process 110
    Fig.5.22 Cross-section and results for Example 1 113
    Fig.5.23 Cross-section and calculation results for Example 2 114
    Fig.6.1 Karst cave in a rock slope 119
    Fig.6.2 Karst mountain landslide in Guizhou Province, Southwest China 120
    Fig.6.3 Final pit limit and location of boreholes encountering karst caves 122
    Fig.6.4 Frequency histogram of length of karst cave 124
    Fig.6.5 Frequency histogram of length of carbonatite 124
    Fig.6.6 Graphical representation of the cross sections of karst caves 126
    Fig.6.7 Illustration of the karst cave stochastic model generator 126
    Fig.6.8 Schematic procedure of the Monte Carlo simulation 127
    Fig.6.9 Illustration of the acceptance-rejection method 129
    Fig.6.10 Flowchart of the karst cave stochastic model generator 130
    Fig.6.11 Stability analysis procedure 132
    Fig.6.12 Cross section geometry of the investigated open pit slope 133
    Fig.6.13 Stereographic projection of the main joint sets 134
    Fig.6.14 Distribution of karst caves within a rectangle (600 m × 200 m) 135
    Fig.6.15 Slope section integrated with a karst cave stochastic model 136
    Fig.6.16 Number of slices and factor of safety 137
    Fig.6.17 Slices for the critical failure surface with N = 10 138
    Fig.6.18 Simulated results for 20 runs 139
    Fig.6.19 Location of critical failure surface for open pit slope without karst cave stochastic model 140
    Fig.6.20 Location of critical failure surface for open pit slope with karst cave stochastic model 141
    Fig.6.21 Relationship between slope angle and height 141
    Fig.6.22 Typical open pit slope geometry 142
    Fig.6.23 Flowchart of the bench face angle optimization 143
    Fig.6.24 Iterative processes for open pit slope without karst cave stochastic model 144
    Fig.6.25 Iterative processes for open pit slope with karst cave stochastic model 145
    Fig.6.26 Locations of the critical failure surfaces associated with the optimized bench face angles for open pit slope without karst cave stochastic model 145
    Fig.6.27 Locations of the critical failure surfaces associated with the optimized bench face angles for open pit slope with karst cave stochastic model 146
    Fig.7.1 Strain-softening in rock mass 152
    Fig.7.2 Illustration of progressive failure (Leroueil et al., 2012) 152
    Fig.7.3 Strain-softening model 153
    Fig.7.4 Example of computation failure 154
    Fig.7.5 Calculation model (Zhang and Zhang, 2007) 155
    Fig.7.6 Relationship between strength reduction factor and horizontal displacement 157
    Fig.7.7 Shear strain increment contours and critical slip surfaces of the example 159
    Fig.7.8 Progressive failure process of the slope 161
    Fig.7.9 Relationship between residual shear strain threshold and critical slip surface 162
    Fig.7.10 Relationship between elastic modulus and critical slip surface 163
    Fig.7.11 Calculation model 164
    Fig.7.12 Relationship between strength reduction factor and horizontal displacement 165
    Fig.7.13 Calculation result 166
    Fig.7.14 Strain-softening zone in limit equilibrium state 167
    Fig.8.1 3D failure in highly weathered, granitic rock 170
    Fig.8.2 Dimensions of 2D cross-section slope 172
    Fig.8.3 Schematic diagram of boundary conditions of 3D model 173
    Fig.8.4 End faces constrained by displacement in z direction, three directions and three directions with assumed symmetry in deformed meshes of 3D slopes 174
    Fig.8.5 Factors of safety and relative differences with different widths of slip surfaces 175
    Fig.8.6 Slip surfaces with different widths of slip surfaces 176
    Fig.8.7 Factors of safety with different cohesions 177
    Fig.8.8 Relative differences with different cohesions 177
    Fig.8.9 Slip surfaces with different cohesions when B/H = 4 178
    Fig.8.10 Factors of safety with different friction angles 178
    Fig.8.11 Relative differences with different friction angles 179
    Fig.8.12 Slip surfaces with different friction angles when B/H = 4 179
    Fig.8.13 Stability charts for 3D slope (β = 15°) 182
    Fig.8.14 Stability charts for 3D slope (β = 30°) 183
    Fig.8.15 Stability charts for 3D slope (β = 45°) 184
    Fig.8.16 Stability charts for 3D slope (β = 60°) 185
    Fig.8.17 Stability charts for 3D slope (β = 75°) 186
    Fig.8.18 Relationship between slope angle and Fs/tanφ (B/H = 4) 187
    Fig.8.19 Relationship between slope angle and relative difference (B/H = 4) 187
    Fig.8.20 Relative differences with cohesionless soils 188
    Fig.8.21 Factors of safety for Example 3 189
    Fig.8.22 Slope with surcharge loading 190
    Fig.8.23 Factors of safety with different loading lengths for infinite slope 191
    Fig.8.24 Slip surfaces with different loading lengths 191
    Fig.8.25 Factor of safety with infinite slope and finite slope (W = 20 m and u = v = w = 0 at model ends) 192
    Fig.8.26 Calculation procedure for slope stability analysis 195
    Fig.9.1 A failure mass for a rock slope with major geological discontinuities 202
    Fig.9.2 Boundary conditions of the DKEM 204
    Fig.9.3 Forces acting on Element i 205
    Fig.9.4 Block partition of Example 1 207
    Fig.9.5 Block partition of Example 2 208
    Fig.9.6 Block partition of Example 3 208
    Fig.9.7 Sub-element effect for Element 1 of Example 3 209
    Fig.9.8 Sub-element effect for Element 2 of Example 3 209
    Fig.9.9 Cross-section geometry of rock slope with persistent discontinuity 210
    Fig.9.10 Cross-section geometries of rock slopes with non-persistent
    Fig.9.11 Factor of safety versus discontinuity persistence 213
    Fig.9.12 Location of critical failure surface versus discontinuity persistence 213
    Fig.9.13 Cross-section geometry and results of the open pit slope with discontinuities 215
    Fig.9.14 Cross-section geometry and results of the open pit slope without discontinuity 215
    Fig.10.1 Types of discontinuities 219
    Fig.10.2 Topographic contours of the highway slope 220
    Fig.10.3 Cross-section geometry of the highway slope 221
    Fig.10.4 Displacement discontinuity components of the crack 222
    Fig.10.5 Respresentation of a curved crack by N elemental displacement discountinuities 223
    Fig.10.6 Flaw loaded in biaxial compression 226
    Fig.10.7 Comparison of mode II SIFs for a single flaw in an infinite body by DDM and analytical solution 226
    Fig.10.8 Numerical model with the existence of a non-persistent filled joint in the DDM code 227
    Fig.10.9 Mode II SIF versus strength reduction factor 228
    Fig.10.10 Components of the bonded interface constitutive model 229
    Fig.10.11 New joint element 231
    Fig.10.12 Geometry and boundary conditions of the FLAC 3D model with a nonpersistent
    filled discontinuity 232
    Fig.10.13 Shear strength versus plastic shear strain 233
    Fig.10.14 Horizontal displacement versus the strength reduction factor 234
    Fig.10.15 Progressive failure process with different strength reduction factors 235
    Fig.10.16 Location of critical failure surface (SRF=1.47) and contour of displacement in a specific area 236
    Fig.10.17 Interface failure state 237
    Fig.10.18 Maximum SIF versus joint inclination 238
    Fig.10.19 Factor of safety versus joint inclination 238
    Fig.10.20 Critical failure surface as delineated by shear strain increment versus joint inclination 239
    Fig.10.21 Crack coalescences observed in our experiments 240
    Fig.11.1 Taibaiyan cliff 244
    Fig.11.2 A rock slope on the Bristen road 245
    Fig.11.3 Geological model of the overhanging slope at the Taibaiyan cliff 248
    Fig.11.4 Other typical cross-sectional geometries of overhanging slopes in the Three
    Gorges Reservoir Region, P.R.of China 249
    Fig.11.5 Numerical model of the overhanging slope at the Taibaiyan cliff 249
    Fig.11.6 Fracture behavior of the overhanging slope 253
    Fig.11.7 Stress intensity factors (KI, KII and Ke) versus crack extension 254
    Fig.11.8 Stability indices (KI, KII, Ke and Fs) versus joint inclination 254
    Fig.11.9 Crack propagation path versus joint inclination 255
    Fig.11.10 Stability indices (KI, KII, Ke and Fs) versus joint length 255
    Fig.11.11 Crack propagation path versus joint length 256
    Fig.11.12 Stability indices (KI, KII, Ke and Fs) versus horizontal distance 257
    Fig.11.13 Crack propagation path versus horizontal distance 257
    Fig.11.14 Rate of undercutting measured in the study site 259
    Fig.11.15 Equivalent stress intensity factor versus notch depth 261
    Fig.11.16 Factor of safety versus notch depth 261
    Fig.11.17 General procedure for short-term and long-term stability assessments 263
    List of Tables
    List of Tables
    Table 1.1 High rock slopes of hydropower engineering in Southwest China (Zhou, 2013) 2
    Table 2.1 Mechanical parameters of the modelling material 24
    Table 3.1 Macromechanical properties of the model material from the experiment and RFPA model results 46
    Table 3.2 Mesomechanical properties of the RFPA elements 52
    Table 3.3 Coefficients for Eq.(3.8) 58
    Table 3.4 Coefficients for Eq.(3.10) 64
    Table 3.5 Coefficients for Eq.(3.11) 66
    Table 4.1 RMR calibrated against rock mass strength 76
    Table 5.1 Results of Example 1 87
    Table 5.2 Results of Example 2 89
    Table 5.3 Results of Example 3 90
    Table 5.4 Comparisons of factors of safety with vertical edges and inclined edges 90
    Table 5.5 Impact factors and allowable factor of safety for Yongping copper mining slope 92
    Table 5.6 Fs/tanφ and Fs/c with the same value of c/tanφ 105
    Table 5.7 Fs/tanφ and Fs/c with different values of c/tanφ 105
    Table 5.8 Factors of safety for different development stages of landslide 106
    Table 5.9 Mechanical parameters of different strata for Example 2 109
    Table 5.10 Comparison of results for reliability index of Example 1 114
    Table 5.11 Calculation results for Example 2 115
    Table 6.1 General geologic stratigraphy of the study site 122
    Table 6.2 Bench and ramp geometries for the designed slope 133
    Table 6.3 Summary of major joint set distributions 134
    Table 6.4 Geotechnical parameters of the open pit slope 134
    Table 6.5 Statistical results for 20 runs 138
    Table 7.1 Strength parameters for strain-softening analysis 155
    Table 7.2 Relationship between number of element and factor of safety 156
    Table 7.3 SRF-u curve-fitting result 158
    Table 7.4 Values of horizontal displacement when SRF varies from 0.951 to 0.954 in strain-softening analysis 158
    Table 7.5 Comparison of results obtained by different methods 159
    Table 7.6 Relationship between residual shear strain threshold and factor of safety
    162
    Table 7.7 Relationship between elastic modulus and factor of safety 163
    Table 7.8 Relationship between Poisson’s ratio and factor of safety 163
    Table 7.9 Relationship between dilation angle and factor of safety 163
    Table 7.10 Geotechnical parameters for strain-softening analysis 164
    Table 7.11 Values of horizontal displacement when SRF varies from 1.401 to 1.404 in
    strain-softening analysis 165
    Table 8.1 Comparison of results from different methods for Example 1 188
    Table 8.2 Factors of safety and failure modes with different model widths when L = 8 m 193
    Table 8.3 Factors of safety and failure modes with different model widths when L = 16 m 193
    Table 9.1 Geotechnical parameters of Example 1 207
    Table 9.2 Geotechnical parameters of Example 2 207
    Table 9.3 Material and slope parameters for the rock slope 210
    Table 9.4 Results with different cases 212
    Table 9.5 Geotechnical parameters of the open pit slope 215
    Table 10.1 Geotechnical parameters of numerical model in FLAC 3D 232
    Table 11.1 Mechanical parameters of the cliff 250
    Table 11.2 Predicted failure times for the four cases 262
帮助中心
公司简介
联系我们
常见问题
新手上路
发票制度
积分说明
购物指南
配送方式
配送时间及费用
配送查询说明
配送范围
快递查询
售后服务
退换货说明
退换货流程
投诉或建议
版权声明
经营资质
营业执照
出版社经营许可证